The optimal array configuration is generally obtained through a compromise between the need of sampling coherent portions of wavefield and the need for adequate azimuthal resolution, which requires a large antenna aperture. However we were limited by the geometry of the underground laboratories, so we decided to start with 20 receivers. In consequence, the underground seismic array has a small aperture (400 m x 600 m) and the average spacing between the short period seismographs is about 90 m (fig. 1 show the map of array), thus allowing to resolve wavelenghts in the range 180-500 m which correspond to phase velocity 0.2-10 km/sec (the frequency response is in the range 1-20 Hz).
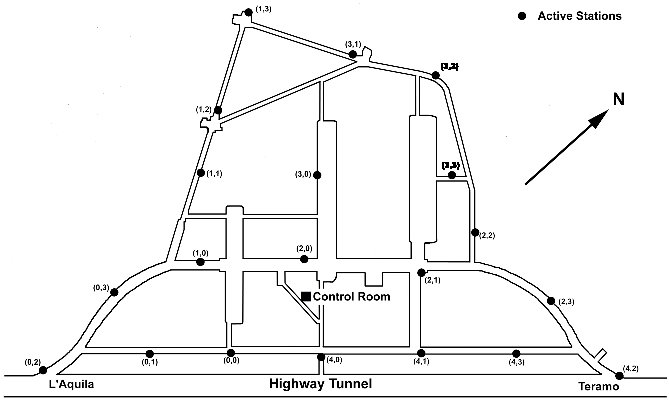
The main advantages of such geometrical configurations are the improvement of signal-to-noise ratio and the possibility to perform a detailed analysis of wave propagation and composition. The array become fully operative since may, 2002. In its present configuration, it consists of 19 three-components short period seismometers (Lennartz 3D-LITE, 1 Hz – fig. 2) and 1 broad-band Guralp GMC-40 T seismometer.
 (fig. 2)
Seismic signals are digitized locally at each individual seismometer with a dynamic range of 24 bits and sampling frequency of 100 Hz. Data synchronization is achieved via a Master Oscillator which transmit the UTC synchronized pulses from an atomic clock to the different ADC boards. The synchronized data packets are then sent via serial cable connection to a set of five nodal PCs, which are in turn connected via an Ethernet network to a central data server and an on-line processor (see fig. 3).
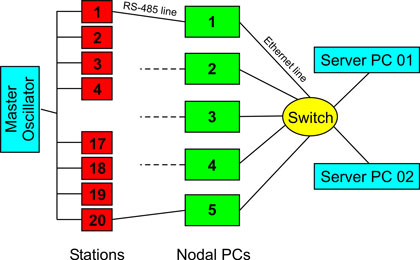 (fig. 3)
The design of the UnderSeis hardware and software components began on the late 90’s; over the following years, major upgrades were developed under a technological effort jointly carried out by engineers from the University of Granada (Spain), University of L’Aquila (now the team moved to the University of Salerno), and I.N.G.V.–Osservatorio Vesuviano.
- Automatic data selection and storage procedure
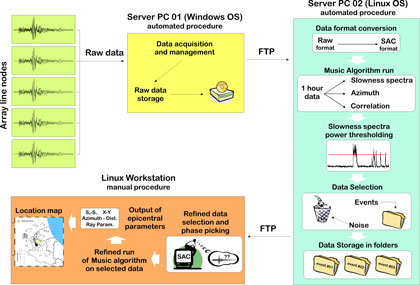
An automatic data selection c-shell script was written. This script runs on a dedicated Linux calculator at L.N.G.S. The script works as follows (fig. 4):
 (fig. 4)
- ten minutes after every hour change (that is few minutes after the array server closes the hourly data recording files), the scripts connects to the array server and downloads all the files related to the correctly working stations;
- it converts these files in SAC (Seismic Analysis Code) format;
- it runs the MUSIC (multiple signal correlation analysis) algorithm, computing the slowness spectra, the propagation azimuth of the wave field and the correlation parameters for the just converted files. MUSIC is run on 2 s sliding (with 50% overlapping) time windows. The slowness search grid varies from -0.5 to 0.5 s/km with a 0.02 s/km step in both x and y direction;
- it runs a procedure for the thresholding of the slowness spectra power;
- if there are any peaks, an info text file is written, the SAC data files are windowed on the correlation peak (50 s before and 100 s after the peak) in order to include the earthquake, and saved them as new files in a new directory.
After the automatic data selection and storage, we perform a refined analysis as follows. Every selected event is checked and phase-picked by an operator. Then MUSIC is run again using a small and finer slowness search grid (-0.24 to 0.24 s/km with a 0.004 s/km step in both x and y direction). This method allows us for a robust and precise estimation of the direction of arrival of plane waves crossing the array. Measurements of propagation azimuths and S-P delay times were then used to evaluate reliable epicentral locations.
- Data analysis and results
Our data span the 2005-2008 time interval, and are associated with the same seismogenic region which caused the destructive Mw=6.3 earthquake of April 6th, 2009. While the analysis of this massive data set is left for future studies, in this work we describe the activity of the UnderSeis array during the 2.5 year long period (July, 2005 - December, 2008) preceding the onset of the sequence. During the analysed time interval, UnderSeis detected more than 1600 earthquakes. For this data set, fig. 5 illustrates the temporal distribution of the daily number of events, the stress release and the magnitude.
 (fig. 5)
In order to compare the detection capabilities of the array with those of INGV’s RSNC (National Centralized Seismic Network), we computed the number of earthquakes detected by the two systems as a function of the distance from the array. The results, reported in fig. 6, indicate that UnderSeis detection performances are better than, or comparable to those of the RSNC up to epicentral ranges on the order of 25 km.
 (fig. 6)
We then stacked all the probability maps associated with individual locations, and eventually calculated the earthquake density (Number of Earthquakes for unit area) for a 50 x 50 km square region centered at the array site (fig. 7a). The array seismicity distribution is substantially different from that of the RSNC catalog. In particular, one of the most prominent feature of the UnderSeis location map is a peak of earthquake location very close to the hypocenter of the April 6th, 2009 mainshock (fig. 7b). This peak, associated with epicenters from the two 2006 swarms, is substantially absent in the RSNC location map, where the 2006 epicenters are shifted some 15 − 20 km to the NW.
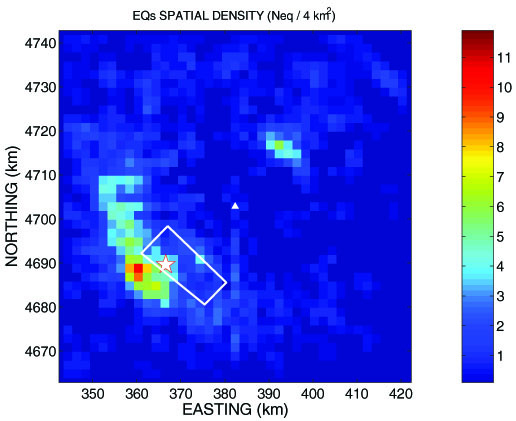 (fig 7a)
 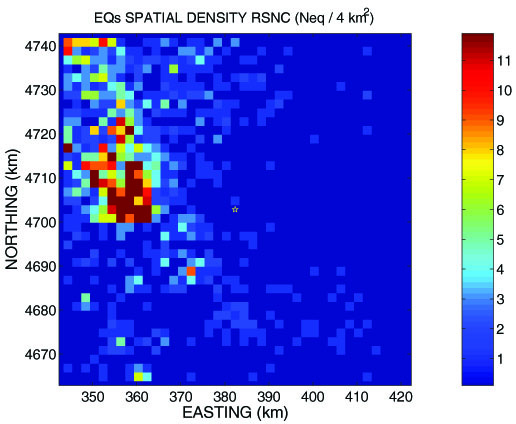 (fig 7b)
Such anomalies can be attributed to one or a combination of the following 2 factors: (1) uncertainties of either RSNC or UnderSeis locations, and (2) a propagation effects due to lateral variations of velocity.
The UnderSeis three-component seismic array provides a powerful monitoring device for delineating a consistent picture of the seismic activity along the Central Apennines, one of the areas depicting the highest seismogenetic potential of Italy. The underground location allows a good detection threshold, which is better than, or comparable to that of the RSNC up to epicentral distances of 25−30 km. Moreover, the continuous recording of multichannel, low-noise seismograms might help revealing the possible existence of other signals of tectonic origin, as those related to slow earthquakes, or deep tremor episodes as reported in the last years for several seismic active regions in the world. The observed azimuthal discrepancies between RSNC and array locations may be attributed to a combination of scarce array resolution and velocity heterogeneities affecting both travel-time and ray geometry predictions. In addition, focusing of energy in the late P-wave wavetrain contributes to significantly bias directional estimates.

 (fig. 2)
 (fig. 3)
 (fig. 5)
 (fig. 6)
 (fig 7a)
  (fig 7b)